

In the fast-evolving landscape of logistics and supply chain management, Warehouse Resource Productivity Standard calculation is a critical factor in ensuring operational efficiency and enhancing customer satisfaction. However, every Warehouse is different in terms of shape & size, MHEs, layout, product slotting, training, order profile etc. Productivity benchmarks is ideally established at the warehouse level. Only Resource wise travel speed and taskwise touch time can be standardized across the warehouses.
Defining Resource Productivity Standard requires a thorough understanding of various factors that differ from one warehouse to another, including warehouse size, material handling equipment (MHE), order profiles, slotting, layout, labor skill levels and work allocation effectiveness.
Our approach considers these variables and breaks down each task to the activity level to calculate the standard time for completion of a task. This forms a key part of our "Work Order & Resource Management" (WORM) module.
This guide explores the essential components of advanced warehouse resource productivity standard, including calculation methods, task classifications, and the impact of various operational levers.
.png)
There are four types of losses:
Warehouse resource productivity is segmented into four primary components:
.png)
1. Work Availability (A)
Formula: Actual Work Hours / Available Hours
Definition: Work Availability measures how efficiently the available labor hours are utilized in performing tasks within the warehouse. It indicates the extent to which available time is actively used for productive work rather than being lost due to inefficiencies.
Key Levers & Explanations:
2. Resource Productivity (P)
Formula: Standard Hours / Actual Work Hours
Definition: Resource Productivity evaluates how effectively the workforce completes assigned tasks within the expected time frame. Higher resource productivity indicates that employees are working efficiently, minimizing idle time and meeting performance standards.
Key Levers & Explanations:
3. Value Add Rate (V)
Formula: (Inbound Standard Hours + Outbound Standard Hours) / Total Standard Hours
Definition: The Value Add Rate measures the proportion of time spent on productive, value-adding activities such as receiving, putaway, picking and shipping. Reducing non-value-adding tasks improves overall warehouse efficiency.
Key Levers & Explanations:
4. System Effectiveness (S)
Formula: Value Add Benchmark Hours / Value Added Standard Hours
Definition: System Effectiveness assesses how well warehouse operations align with industry benchmarks and best practices. A high system effectiveness score indicates that operations are running smoothly and adhering to optimized processes.
Key Levers & Explanations:
Warehouse tasks are typically categorized into two primary productivity model type:
Productivity Calculation Methods:
C.1. Pick & Drop Tasks
These tasks focus on the movement of goods within the warehouse, with productivity calculations factoring:
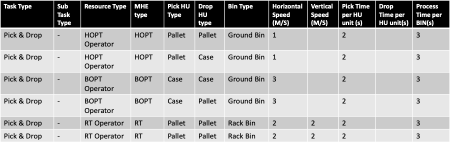
Example Calculation:
Pick 10 Cases from Bin 1 and Pick 30 Cases from Bin 2 and Drop to Loading Staging area; Bin 1 to Bin 2 is 15 meters, Bin 1 from Dock area is 48 meters, and Bin 2 to Loading Staging area is 60 meters. Operator is using BOPT.
Total Standard Time = 48/3 for travel from Dock to Bin 1, 3 seconds for processing at Bin 1, 10×2 for pick time at Bin 1, 15/3 for travel from Bin 1 to Bin 2, 3 seconds for processing at Bin 2, 30×2 for pick time at Bin 2, and 60/3 for travel from Bin 2 to Loading Staging area; Total time taken is 127 seconds.
C.2. Workstation Tasks:
Tasks at fixed workstations like receiving and loading have distinct productivity standards. These are measured by the process time per handling unit and the overall time per work order.
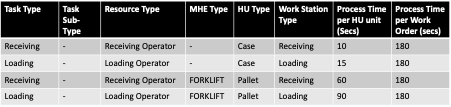
Example Calculation:
Example 3: If 150 Cases to be picked and staged using BOPT. It would take:
150*12 + 240 = 2040 Resource secs (if there are 3 resources – it will take 680 secs to complete the task)
Example 4: If 35 Pallets to be shifted from Receiving to Storage using Reach Truck. It would take:
35*100 + 300 = 3800 Resource secs (if there are 2 Reach Trucks – it will take 1900 secs to complete the task)
Example 5: If 500 Cases to be sorted and stacked using HOPT. It would take:
500*15 + 180 = 7680 Resource secs (if there are 4 resources – it will take 1920 secs to complete the task)
Measuring and optimizing warehouse productivity is a multifaceted challenge that demands a nuanced approach to warehouse resource productivity standard, a deep understanding of task classifications and resource efficiency. By implementing detailed productivity standard models and leveraging continuous improvement strategies, businesses can enhance warehouse operations, reduce costs, and improve service levels.

MD, Co-Founder | Stackbox

