
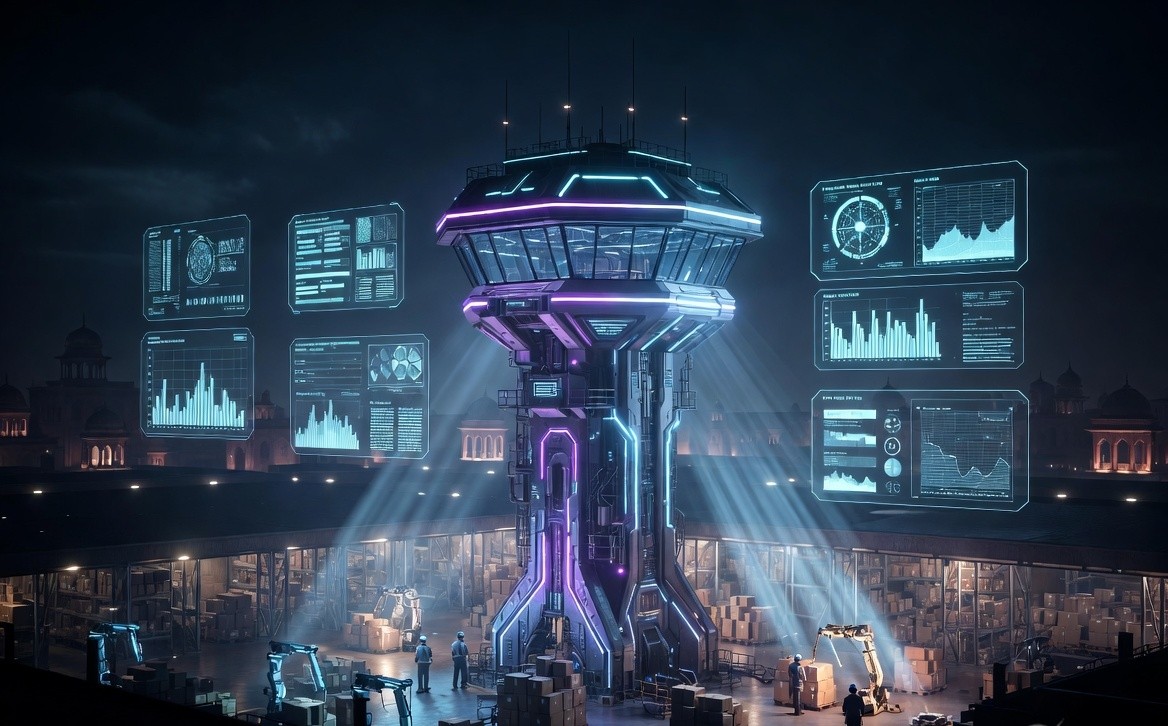
A warehouse control tower in India fundamentally changes how operations managers make decisions. On an average shift in a 200,000-square-foot Indian warehouse, the operations manager makes fifty to eighty micro-decisions: which zone needs more pickers, which dock is falling behind, which orders are at risk of missing the 2pm cutoff, whether the afternoon wave can absorb the pending backlog. Today, most of these decisions are made by walking the floor, fielding radio calls, and relying on instinct built from years of experience.
Experience is valuable. But instinct cannot process eighty data streams simultaneously, cannot detect a problem in Zone C while standing in Zone A, and cannot predict that the 3pm wave will miss dispatch by twenty-two minutes based on the current pick rate. A control tower can.
This article is for Indian operations leaders who are managing warehouses through floor walks and spreadsheets and want to understand what a real-time control tower actually shows, what decisions it enables, and what measurable operational impact it delivers.
A warehouse control tower is a unified, real-time operational dashboard that aggregates data from every warehouse process into a single view. It is not a reporting tool that tells you what happened yesterday. It is an exception management and decision-support system that tells you what is happening right now, flags what is going wrong, and increasingly predicts what will go wrong next.
The concept of a control tower is well established in transportation management—logistics teams have used transport control towers for years to track shipments, manage exceptions, and coordinate carriers. The warehouse control tower applies the same principle to the facility itself: real-time visibility into every movement, task, exception, and resource across the operation.
A properly configured warehouse control tower provides real-time visibility across five operational dimensions:
Pending goods receipt notes, dock utilisation by time of day, unloading turnaround time, quality holds pending clearance, and advance shipping notice alignment (what was expected versus what arrived). For Indian warehouses receiving multiple carriers in a compressed morning window, this view prevents dock congestion before it happens.
Wave progress (percentage complete by wave, by zone), pick rate per zone (lines per hour), SLA clock by order (time remaining before dispatch cutoff), individual picker productivity (actual versus target), and zone congestion indicators. This is the view that enables mid-shift resource reallocation—the highest-impact real-time decision an operations manager makes.
Outbound dock queue (which shipments are staged, which are loading), dispatch SLA status by carrier and client, carrier arrival confirmation, and pending documentation. For 3PL operations managing multiple client SLAs, this view determines whether the afternoon dispatch window meets every client’s cutoff.
Live task allocation across all operators, idle resource alerts (operators without assigned tasks), interleaving efficiency (productive versus non-productive movement), and shift productivity trends. This view identifies labour imbalances in real time—a problem that traditional supervision detects twenty to thirty minutes too late.
Late orders approaching SLA breach, pick errors flagged by scan validation, inventory discrepancies detected during picks or counts, equipment downtime alerts, and temperature excursion alerts for cold-chain zones. The exception dashboard is the core value proposition of a control tower: every exception visible, prioritised by impact, with time-to-resolution tracked.
The fundamental operational shift a control tower enables is the move from management by floor walk to management by exception. In the traditional model, a supervisor discovers problems by physically inspecting zones, talking to pickers, checking paperwork, and making radio calls. The problem discovery lag is typically fifteen to thirty minutes—by which time the problem has already cascaded.
In the control tower model, exceptions are flagged the moment they occur:
Pick accuracy drops below 99% in Zone C — alert fires immediately. The supervisor checks the root cause (new picker, mislabelled bin, slotting error) and resolves it before it compounds.
Dock 3 is running behind its unloading SLA — alert fires with the specific delay and its downstream impact on the afternoon wave. Resources can be reallocated before the delay cascades.
Twelve orders are at risk of missing the 2pm cutoff — alert fires at 1:15pm with a suggested action: allocate three additional pickers from Zone B (which is running 20 minutes ahead of target). The manager makes one decision; the control tower provides the data to make it confidently.
Without control tower: problem discovery takes 15–30 minutes. Assessment takes another 10–15 minutes. Resource reallocation takes 10–20 minutes. Total: 35–65 minutes from problem occurrence to corrective action. By that point, the problem has cascaded to downstream processes.
With control tower: problem flagged at occurrence (0 minutes). Impact assessment presented on screen (0 minutes). Suggested corrective action displayed (0 minutes). Manager executes the recommendation (2–5 minutes). Total: 2–5 minutes from problem to corrective action. The cascade is prevented.
ApproachProblem DiscoveryAssessmentActionTotal CycleFloor Walk (Reactive)15–30 min10–15 min10–20 min35–65 minControl Tower (Proactive)InstantOn-screen2–5 min2–5 min
For a warehouse processing 5,000 order lines per shift, the difference between a 30-minute reaction time and a 5-minute reaction time compounds across every shift, every week, every quarter. The control tower does not just improve visibility—it compresses the decision-action cycle by an order of magnitude.
India’s GST consolidation has driven companies from thirty state depots to five to eight regional distribution centres. This consolidation creates a structural need for multi-site visibility that individual warehouse dashboards cannot deliver.
A multi-site control tower provides a single dashboard across five, ten, or twenty DCs—enabling operations leaders to compare productivity across sites (why is Pune running at 85% while Bangalore is at 72%?), redistribute stock between sites based on real-time demand signals, maintain a unified SLA view across all clients regardless of which DC handles their orders, and identify systemic patterns (if pick accuracy drops across all sites simultaneously, the root cause is likely a master data issue, not a local problem).
For Indian 3PL operators managing multiple brand clients across multiple sites, the multi-site control tower is the layer that makes it possible to run the operation from a central team—without requiring a senior ops manager physically present at every site.
CapabilitySingle-Site DashboardMulti-Site Control TowerVisibility scope1 warehouse5–20+ DCs nationallyCross-site comparisonNot possibleProductivity benchmarkingStock redistributionManual, offlineReal-time, data-drivenUnified SLA viewPer-site onlyAll clients, all sitesPattern detectionLocal anomalies onlySystemic issues visible
Current-generation control towers show what is happening now. Next-generation control towers—including Stackbox’s—add predictive capability: showing what will happen if current conditions continue and recommending specific actions to change the outcome.
Example: At the current pick rate in Zone A, the 3pm wave will miss the dispatch cutoff by twenty-two minutes. Suggested action: reallocate three pickers from Zone B (currently running 20 minutes ahead of target) to Zone A. Expected impact: 3pm wave completes on time with 8 minutes to spare.
Predictive alerts transform the control tower from a visibility tool into a decision engine. The operations manager does not need to calculate the impact manually—the system presents the problem, the consequence, and the recommended action in a single view.
Real-time operational dashboard. Every movement, every task, every exception displayed on a single screen with configurable views by role (floor supervisor, shift manager, operations director, 3PL client).
Configurable alert thresholds. Define exception triggers for pick accuracy, SLA clocks, dock utilisation, picker productivity, and any custom metric. Thresholds differ by client in 3PL operations.
Multi-site view. Single dashboard across all DCs. Cross-site productivity comparison, stock redistribution, and unified SLA monitoring.
Predictive SLA breach alerts. Flags at-risk orders before the breach occurs and recommends specific resource reallocation to prevent it.
Client portal layer for 3PL. Each brand client gets their own control tower view—live inventory, order status, SLA performance—with database-level data isolation.
Mobile access. Floor supervisors access the control tower from mobile devices—no need to return to the office to check a dashboard.
Proprietary guardrail metrics. Stackbox Research provides industry-benchmarked productivity targets (orders per hour, cases per picker per shift, dock-to-stock time) calibrated from FMCG, pharma, 3PL, and e-commerce deployments across India. These guardrails give operations leaders a standard to measure against—not just internal historical performance, but industry-best performance.
Q: What is a warehouse control tower?
A: A warehouse control tower is a unified, real-time operational dashboard aggregating data from every warehouse process—inbound, picking, dispatch, labour, and exceptions—into a single view. It enables management by exception rather than management by floor walk, compressing the decision-action cycle from 30+ minutes to under 5 minutes.
Q: Can a control tower manage multiple warehouse sites in India?
A: Yes. Stackbox’s control tower provides a single dashboard across multiple DCs—enabling cross-site productivity comparison, stock redistribution, and unified SLA monitoring. Critical for Indian enterprises that have consolidated from 30 state depots to 5–8 regional DCs.
Q: Does Stackbox’s control tower include predictive alerts?
A: Yes. Stackbox’s control tower includes predictive SLA breach alerts that flag at-risk orders before the breach occurs, quantify the expected impact, and recommend specific corrective actions (e.g., reallocate pickers from an ahead-of-schedule zone).
Q: What KPIs does a warehouse control tower track?
A: Throughput KPIs (orders/hour, cases per picker), accuracy KPIs (pick accuracy, inventory accuracy), SLA KPIs (on-time dispatch, breach rate by client), labour KPIs (tasks per operator, idle time, interleaving efficiency), and exception KPIs (exception rate, mean time to resolution).
Q: Can 3PL clients access the control tower?
A: Yes. Stackbox provides a client portal layer with live inventory, order status, and SLA performance per client—with database-level data isolation ensuring each client sees only their own operations.
We’ll show you a live demo with your operational metrics and KPI framework in mind—no commitment, 30-minute walkthrough.


